Hillshades: A QGIS Tool for Improved LiDAR Data Visualization
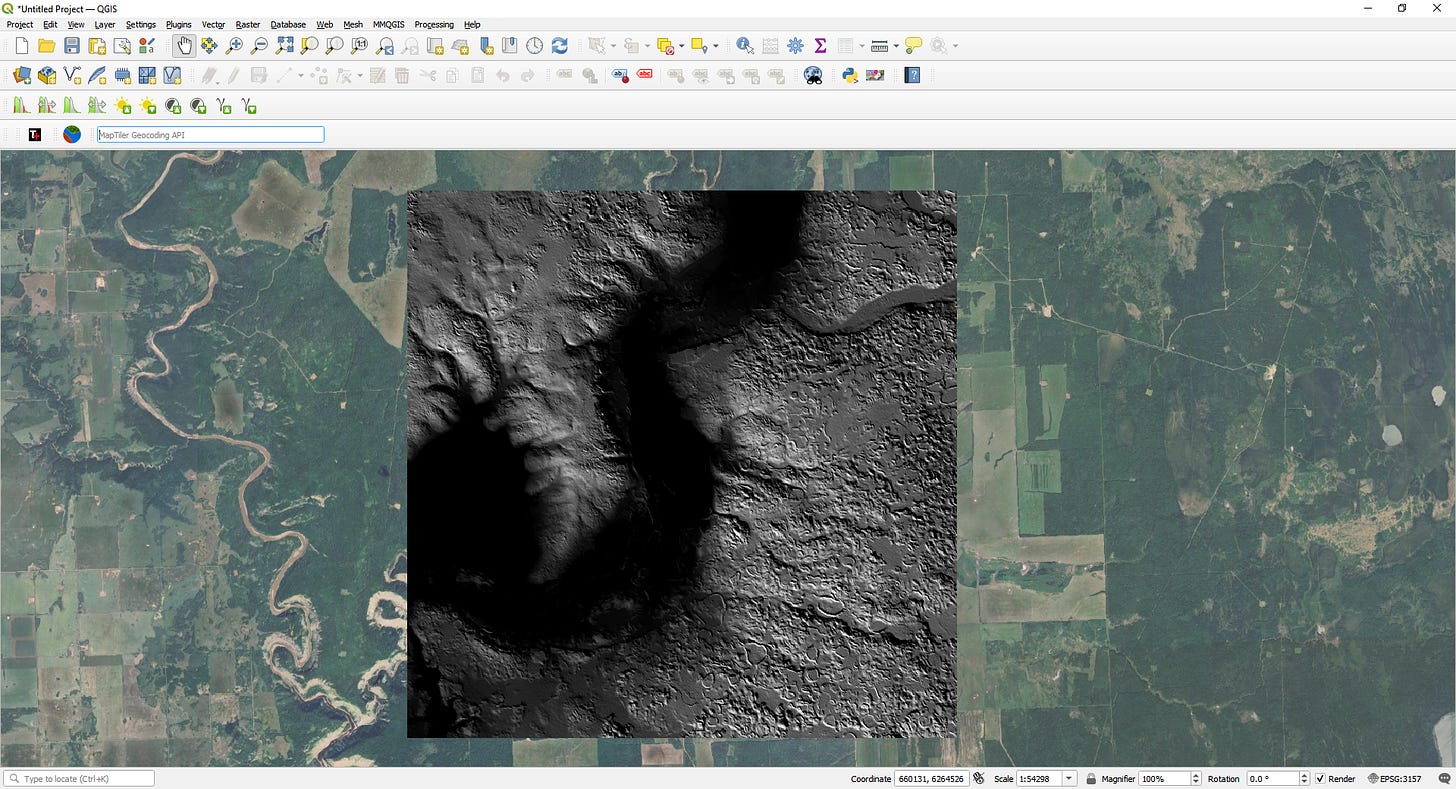
Hillshades, a technique that simulates the effect of sunlight on terrain, are indispensable for unlocking the full potential of LiDAR data. Hillshades provide a more intuitive and visually compelling representation of the landscape by casting shadows based on elevation.
Why Hillshades Matter
Enhanced Feature Visibility: Hillshades amplify subtle topographic details often obscured in raw LiDAR data, making it easier to identify landforms, delineate watersheds, and assess areas of potential erosion.
Contextual Understanding: By adding depth and dimension to elevation data, hillshades provide a more contextual understanding of the terrain, aiding in tasks such as site selection, infrastructure planning, and environmental impact assessments.
Data Integration: Hillshades can be seamlessly integrated with other spatial data layers, such as vegetation maps or land use classifications, to create more comprehensive and informative visualizations.
In essence, hillshades serve as a bridge between raw LiDAR data and actionable insights, making them a cornerstone of modern GIS analysis.
Step-by-Step Guide: Using the Hillshade Function in QGIS
Importing LiDAR Data
Open QGIS: Start by launching QGIS on your computer.
Add Raster Layer:
Navigate to
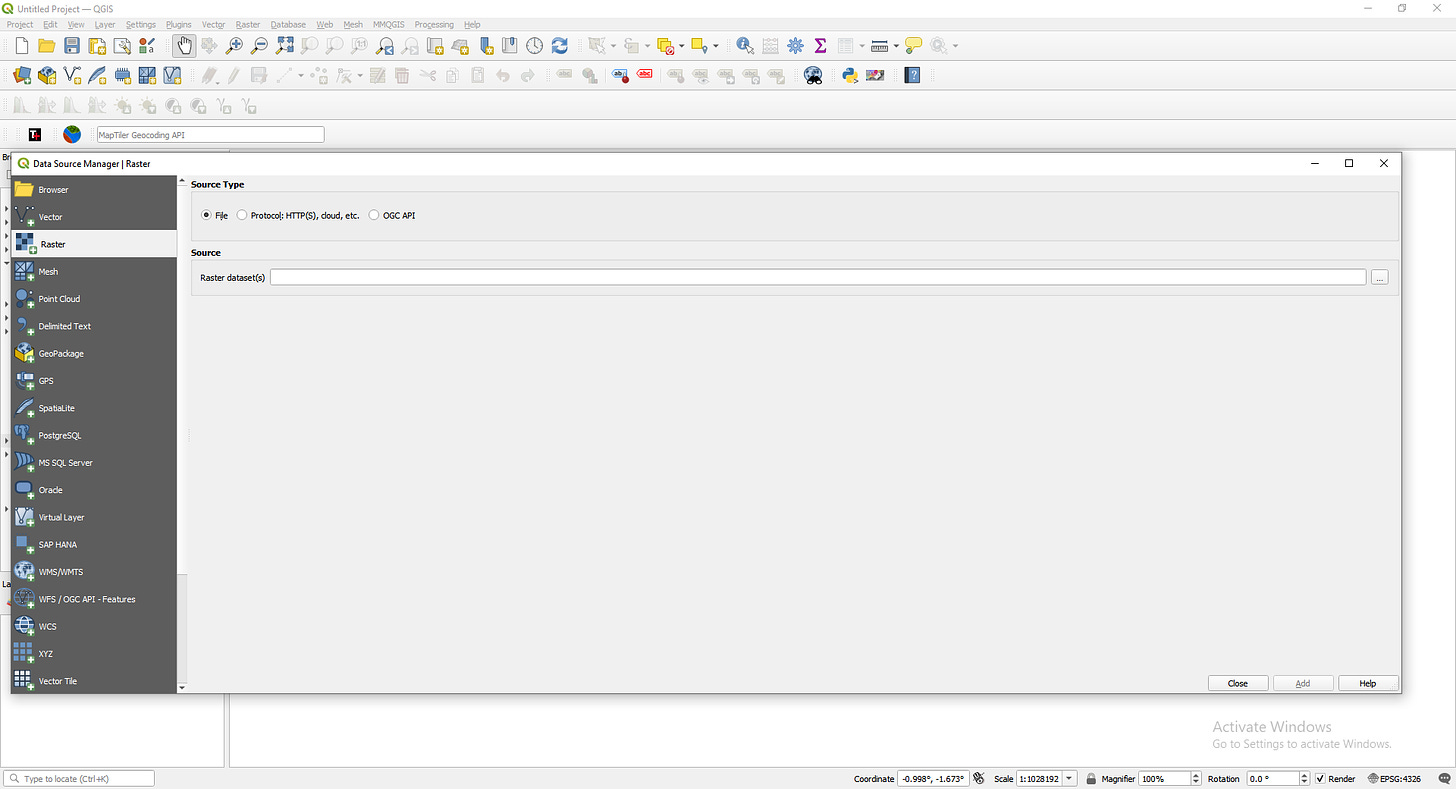
Layer>Add Layer>Add Raster Layeror click theAdd Raster Layerbutton in the toolbar.
In the dialog that appears, browse to the location of your LiDAR DEM GeoTIFF file, select it, and click Open.
Viewing the Data:
Once loaded, your DEM will appear as a grayscale image in the QGIS map canvas, where lighter shades represent higher elevations and darker shades represent lower elevations.
Keep reading with a 7-day free trial
Subscribe to Open Source Compendium to keep reading this post and get 7 days of free access to the full post archives.


